Blog
Microsoft Power bi Professional Training in Nigeria
- August 15, 2023
- Posted by: Admin@Remoik
- Category: Training programmes
In-depth Microsoft Power bi Training-increasing your business productivity
Microsoft Power bi professional classroom training in Nigeria, Learn how to turn data into powerful insights that direct and drive informed business decisions – giving your business the edge over competitors. By taking our Microsoft Power BI training course, anyone can become a competent data analyst.
The user-friendly Power BI reporting application has been designed to help users, of all experiential levels, produce insightful data analysis – hence our interactive and highly engaging BI training course helps candidates across departments communicate performance-related data in a visually understandable manner.

The Microsoft Power BI tool allows you to extract, analyze and comprehend large quantities of data – helping to ensure that you can present data in a logical manner and make informed business decisions. The Microsoft Power BI is the most user-friendly report-based analytical tool, that is transforming the way that businesses read their performance data.
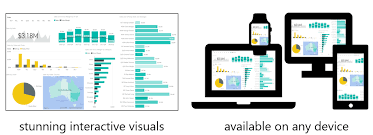
Driving ad-hoc analysis and promoting the creation of personalized data dashboards, learning how to utilize the Power BI enhances an individual’s and business’s potential. During this extensive and interactive three-day Power BI course, candidates will learn how to publish reports directly onto the Power BI Report Server – enabling colleagues and stakeholders to appreciate the insightful data analysis from their phones, tablets, and laptops. Additionally, the flexibility of the Power BI Suite is demonstrated by the ability to unify your organization’s data by uploading and sharing information on Cloud-based platforms – Remoik’s engaging expertise will show you how to share your data analysis with stakeholders on the Cloud too.
The course will cover:

- Power BI’s strengths and weaknesses compared to the other popular BI tools
- Important concepts of Power BI
- Connecting to any type of data source (from structured to unstructured which will require some transforming)
- Getting data from existing services, organizational content pack, flat files and live databases
- Data Transformation (very broad and requires some knowledge of data analysis) and we will use DAX and M formulas too.
- Creating relationships between the datasets and leveraging hierarchy
- Creating Reports
- Visualizations and the science behind choosing the right visuals
- Importing custom visuals (especially word cloud for sentiment analysis and other very useful non-native visuals)
- Creating dashboards
- Publishing Reports from the Power BI Desktop and pinning to dashboards
- Scheduling refresh
- Q & A Natural Language query
- Integrating with Cortana
- Live Dashboards
- Collaboration and sharing
- Printing the dashboard
- Analyzing the dashboard data (report) from Power BI service in Excel (new feature)
- Value Proposition to corporate customers
- Use case scenarios for an entire company or business unit or departments
The Microsoft Power bi Training includes the following modules:
Module 1: Introduction to Microsoft Power bi
- What is Microsoft Power bi?
- The Power BI service
- Power BI Report Server
- Power BI Desktop
- Reports and Dashboards
- Datasets
- Row-Level Security
- Content Packs
- Natural Language Queries
- Data Sources
Module 2: Connecting to Files
- Importing Excel Files
- Publishing to Power BI from Excel
- Updating Files in Power BI
- Data Refresh
- The Power BI Data Model
- Managing Data Relationships
- Optimizing the Model for Reporting
- Hierarchies
- SQL Servers
- Other Data Sources
- R Script Data Connector
- Configuring Data for Q&A
- Creating Content Packs
- Creating a Group
- Shaping and Combining Data

Module 3: The Query Editor
- Applied Steps
- Advanced Editor
- Shaping Data
- Formatting Data
- Transforming Data
- Combining Data
- Merging Data
- Modelling Data
Module 4: What are Relationships?
- Viewing Relationships
- Creating Relationships
- Cardinality
- Cross Filter Direction
- What is DAX?
- Syntax
- Functions
- Context
- Calculated Columns
- Calculated Tables
- Measures
- Interactive Data Visualisations
Module 5: Microsoft Power bi Reports: Page Layout and Formatting
- Multiple Visualisations
- Creating Charts
- Using Geographic Data
- Histograms
- Power BI Admin Portal
- Service Settings
- Desktop Settings
- Dashboard and Report Settings